
HDFC Dynamic Debt Fund - Growth Option
Fund Manager : Anil Bamboli, Dhruv Muchhal | Benchmark : CRISIL Dynamic Bond Fund BIII Index | Category : Debt: Dynamic Bond
NAV as on 17-05-2024
AUM as on 30-04-2024
Rtn ( Since Inception )
8.08%
Inception Date
Apr 28, 1997
Expense Ratio
1.54%
Fund Status
Open Ended Scheme
Min. Investment (Rs)
100
Min. Topup (Rs)
100
Min. SIP Amount (Rs)
500
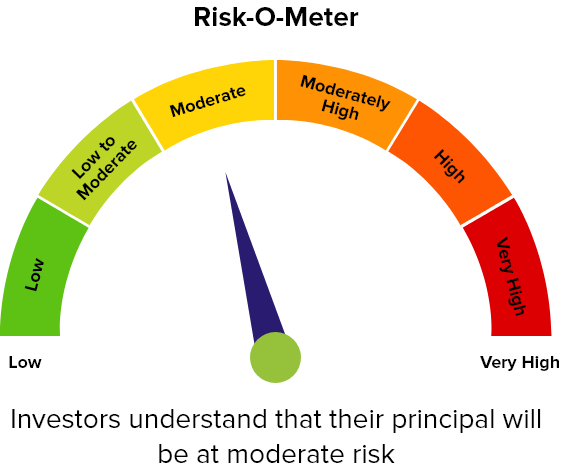
Risk Status
moderate
Investment Objective : Erstwhile ITC High Interest, the scheme aims at income generation by investing at least 95 per cent of the corpus in fixed income and money market instruments. Besides change in the name the scheme has also, changed hands from ITC Threadneedle AMC to Zurich India AMC.
Returns (%)
| 1 Mon (%) | 3 Mon (%) | 6 Mon (%) | 1 Yr (%) | 3 Yrs (%) | 5 Yrs (%) | 10 Yrs (%) | |
|---|---|---|---|---|---|---|---|
| Fund | 1.05 | 1.67 | 4.19 | 6.61 | 6.23 | 6.69 | 6.92 |
| Benchmark - S&P BSE India Bond Index | 1.09 | 1.83 | 4.77 | 7.13 | 5.9 | 7.63 | 8.48 |
| Category - Debt: Dynamic Bond | 1.1 | 1.47 | 4.17 | 6.26 | 5.23 | 6.39 | 7.37 |
| Rank within Category | 13 | 4 | 10 | 7 | 3 | 9 | 13 |
| Number of Funds within Category | 22 | 22 | 22 | 22 | 21 | 21 | 17 |
Returns less than 1 year are in absolute and Returns greater than 1 year period are compounded annualised (CAGR)
Debt Holdings (Top 10)
| Sector | Allocation (%) |
|---|
Credit Quality Break Down
| Credit Quality | Portfolio (%) |
|---|---|
| SOV | 80.08 |
| AAA | 14.94 |
| AA | - |
| A | - |
| BBB | - |
| Below BBB | - |
| D | - |
Asset Type (Top 5)
| GOI Securities | 74.05 |
| Debenture | 14.94 |
| State Development Loan | 6.03 |
| Repo | 1.75 |
| Infrastructure Investment Trust | 1.66 |
Portfolio Behavior
| Mean | 5.97 |
| Sharpe Ratio | 0.21 |
| Alpha | 0.83 |
| Beta | 0.41 |
| Standard Deviation | 3.36 |
| Sortino | 0.67 |
Debt Profile
| Scheme | Category | % of Change | |
|---|---|---|---|
| Modified Duration | 6.41 | 6.72 | 16.12 |
| Average Maturity | 11.81 | 12.45 | 19.66 |
| Yield To Maturity | 7.4 | 7.33 | -0.54 |
Yearly Performance (%)
Standard Performance
Riskometer
SIP Returns (Monthly SIP of Rs. 10,000)
| 3 Year | 5 Year | 10 Year | 15 Year | |||||||||
|---|---|---|---|---|---|---|---|---|---|---|---|---|
| Scheme Name | Invested Amt | Current Value | XIRR (%) | Invested Amt | Current Value | XIRR (%) | Invested Amt | Current Value | XIRR (%) | Invested Amt | Current Value | XIRR (%) |
| HDFC Dynamic Debt Gr | 360,000 | 392,285 | 5.98 | 600,000 | 696,808 | 6.12 | 1,200,000 | 1,621,662 | 5.96 | 1,800,000 | 3,030,974 | 6.68 |
| S&P BSE India Bond Index | 360,000 | 399,344 | 7.24 | 600,000 | 705,918 | 6.65 | 1,200,000 | 1,762,401 | 7.58 | 1,800,000 | 3,395,654 | 8.07 |
| Debt: Dynamic Bond | 360,000 | 393,567 | 6.21 | 600,000 | 690,659 | 5.74 | 1,200,000 | 1,664,170 | 6.46 | 1,800,000 | 3,180,870 | 7.26 |
Disclaimer : Mutualfundtools.com has gathered all the data, information, statistics from the sources believed to be highly reliable and true. All necessary precautions have been taken to avoid any error, lapse or insufficiency, however, no representations or warranties are made (express or implied) as to the reliability, accuracy or completeness of such information. mutualfundtools.com cannot be held liable for any loss arising directly or indirectly from the use of, or any action taken in on, any information appearing herein.
Returns less than 1 year are in absolute and greater than 1 year are compounded annualised (CAGR). SIP returns are shown in XIRR (%).
The Risk Level of any of the schemes must always be commensurate with the risk profile, investment objective or financial goals of the investor concerned. Mutual Fund Distributors (MFDs) or Registered Investment Advisors (RIAs) should take the risk profile and investment needs of individual investors into consideration and make scheme(s) or asset allocation recommendations accordingly.
Mutual Fund investments are subject to market risks, read all scheme related documents carefully. Past performance may or may not be sustained in the future. Investors should always invest according to their risk appetite and consult with their mutual fund distributors or financial advisor before investing.